 |
 |
 |
 |
 |
 |
 |
 |
 |
 |
 |
 |
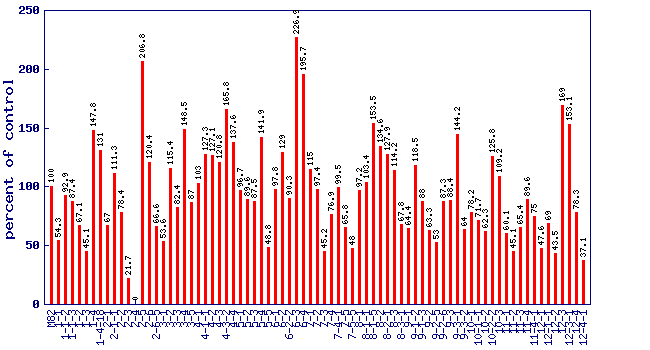
| Relative oxygen radical absorbance capacity level (percent of control)* Experiment: nutrition related metabolite profiling in S. pennellii IL lines (NY, Summer 2001, Field) |
 |
| line | relative level (percent of control) |
|---|---|
| M82 | 100 |
| 1-1 | 54.3 |
| 1-1-2 | 92.9 |
| 1-1-3 | 87.4 |
| 1-2 | 67.1 |
| 1-3 | 45.1 |
| 1-4 | 147.8 |
| 1-4-18 | 131 |
| 2-1 | 67 |
| 2-1-1 | 111.3 |
| 2-2 | 78.4 |
| 2-3 | 21.7 |
| 2-4 | 0 |
| 2-5 | 206.8 |
| 2-6 | 120.4 |
| 2-6-5 | 66.6 |
| 3-1 | 53.6 |
| 3-2 | 115.4 |
| 3-3 | 82.4 |
| 3-4 | 148.5 |
| 3-5 | 87 |
| 4-1 | 103 |
| 4-1-1 | 127.3 |
| 4-2 | 127.1 |
| 4-3 | 120.8 |
| 4-3-2 | 165.8 |
| 4-4 | 137.6 |
| 5-1 | 96.7 |
| 5-2 | 89.6 |
| 5-3 | 87.5 |
| 5-4 | 141.9 |
| 5-5 | 48.8 |
| 6-1 | 97.8 |
| 6-2 | 129 |
| 6-2-2 | 90.3 |
| 6-3 | 226.9 |
| 6-4 | 195.7 |
| 7-1 | 115 |
| 7-2 | 97.4 |
| 7-3 | 45.2 |
| 7-4 | 76.9 |
| 7-4-1 | 99.5 |
| 7-5 | 65.8 |
| 7-5-5 | 48 |
| 8-1 | 97.2 |
| 8-1-1 | 103.4 |
| 8-1-5 | 153.5 |
| 8-2 | 134.6 |
| 8-2-1 | 127.9 |
| 8-3 | 114.2 |
| 8-3-1 | 67.8 |
| 9-1 | 64.4 |
| 9-1-2 | 118.5 |
| 9-1-3 | 88 |
| 9-2 | 63.3 |
| 9-2-5 | 53 |
| 9-2-6 | 87.3 |
| 9-3 | 88.4 |
| 9-3-1 | 144.2 |
| 9-3-2 | 64 |
| 10-1 | 78.2 |
| 10-1-1 | 71.7 |
| 10-2 | 62.3 |
| 10-2-2 | 125.8 |
| 10-3 | 109.2 |
| 11-1 | 60.1 |
| 11-2 | 45.1 |
| 11-3 | 65.4 |
| 11-4 | 89.6 |
| 11-4-1 | 75 |
| 12-1 | 47.6 |
| 12-1-1 | 69 |
| 12-2 | 43.5 |
| 12-3 | 169 |
| 12-3-1 | 153.1 |
| 12-4 | 78.3 |
| 12-4-1 | 37.1 |
* Note
|