 |
 |
 |
 |
 |
 |
 |
 |
 |
 |
 |
 |
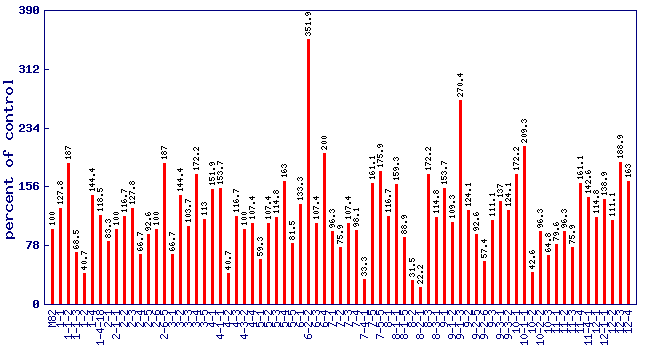
| Relative gamma tocopherol level (percent of control)* Experiment: nutrition related metabolite profiling in S. pennellii IL lines (NY, Summer 2001, Field) |
 |
| line | relative level (percent of control) |
|---|---|
| M82 | 100 |
| 1-1 | 127.8 |
| 1-1-2 | 187 |
| 1-1-3 | 68.5 |
| 1-2 | 40.7 |
| 1-4 | 144.4 |
| 1-4-18 | 118.5 |
| 2-1 | 83.3 |
| 2-1-1 | 100 |
| 2-2 | 116.7 |
| 2-3 | 127.8 |
| 2-4 | 66.7 |
| 2-5 | 92.6 |
| 2-6 | 100 |
| 2-6-5 | 187 |
| 3-1 | 66.7 |
| 3-2 | 144.4 |
| 3-3 | 103.7 |
| 3-4 | 172.2 |
| 3-5 | 113 |
| 4-1 | 151.9 |
| 4-1-1 | 153.7 |
| 4-2 | 40.7 |
| 4-3 | 116.7 |
| 4-3-2 | 100 |
| 4-4 | 107.4 |
| 5-1 | 59.3 |
| 5-2 | 107.4 |
| 5-3 | 114.8 |
| 5-4 | 163 |
| 5-5 | 81.5 |
| 6-1 | 133.3 |
| 6-2-2 | 351.9 |
| 6-3 | 107.4 |
| 6-4 | 200 |
| 7-1 | 96.3 |
| 7-2 | 75.9 |
| 7-3 | 107.4 |
| 7-4 | 98.1 |
| 7-4-1 | 33.3 |
| 7-5 | 161.1 |
| 7-5-5 | 175.9 |
| 8-1 | 116.7 |
| 8-1-1 | 159.3 |
| 8-1-5 | 88.9 |
| 8-2 | 31.5 |
| 8-2-1 | 22.2 |
| 8-3 | 172.2 |
| 8-3-1 | 114.8 |
| 9-1 | 153.7 |
| 9-1-2 | 109.3 |
| 9-1-3 | 270.4 |
| 9-2 | 124.1 |
| 9-2-5 | 92.6 |
| 9-2-6 | 57.4 |
| 9-3 | 111.1 |
| 9-3-1 | 137 |
| 9-3-2 | 124.1 |
| 10-1 | 172.2 |
| 10-1-1 | 209.3 |
| 10-2 | 42.6 |
| 10-2-2 | 96.3 |
| 10-3 | 64.8 |
| 11-1 | 79.6 |
| 11-2 | 96.3 |
| 11-3 | 75.9 |
| 11-4 | 161.1 |
| 11-4-1 | 142.6 |
| 12-1 | 114.8 |
| 12-1-1 | 138.9 |
| 12-2 | 111.1 |
| 12-3 | 188.9 |
| 12-4 | 163 |
* Note
|