 |
 |
 |
 |
 |
 |
 |
 |
 |
 |
 |
 |
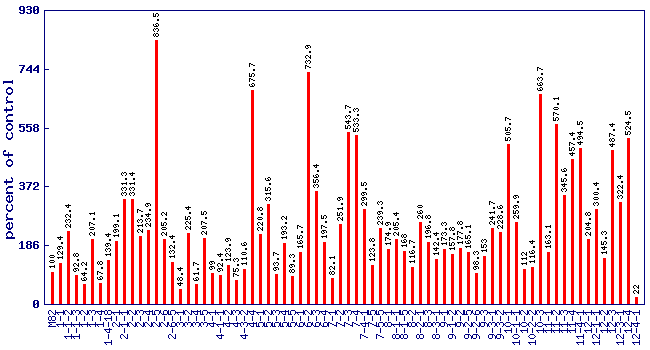
| Relative 2-methylbutanal level (percent of control)* Experiment: flavor related metabolite profiling in S. pennellii IL lines (FL, Spring 2003, Field) |
 |
| line | relative level (percent of control) |
|---|---|
| M82 | 100 |
| 1-1 | 129.4 |
| 1-1-2 | 232.4 |
| 1-1-3 | 92.8 |
| 1-2 | 64.2 |
| 1-3 | 207.1 |
| 1-4 | 67.8 |
| 1-4-18 | 139.4 |
| 2-1 | 199.1 |
| 2-1-1 | 331.3 |
| 2-2 | 331.4 |
| 2-3 | 213.7 |
| 2-4 | 234.9 |
| 2-5 | 836.5 |
| 2-6 | 205.2 |
| 2-6-5 | 132.4 |
| 3-1 | 48.4 |
| 3-2 | 225.4 |
| 3-4 | 61.7 |
| 3-5 | 207.5 |
| 4-1 | 99 |
| 4-1-1 | 92.4 |
| 4-2 | 123.9 |
| 4-3 | 75.3 |
| 4-3-2 | 110.6 |
| 4-4 | 675.7 |
| 5-1 | 220.8 |
| 5-2 | 315.6 |
| 5-3 | 93.7 |
| 5-4 | 193.2 |
| 5-5 | 89.3 |
| 6-1 | 165.7 |
| 6-2 | 732.9 |
| 6-3 | 356.4 |
| 6-4 | 197.5 |
| 7-1 | 82.1 |
| 7-2 | 251.9 |
| 7-3 | 543.7 |
| 7-4 | 533.3 |
| 7-4-1 | 299.5 |
| 7-5 | 123.8 |
| 7-5-5 | 239.3 |
| 8-1 | 174.9 |
| 8-1-1 | 205.4 |
| 8-1-5 | 168 |
| 8-2 | 116.7 |
| 8-2-1 | 260 |
| 8-3 | 196.8 |
| 8-3-1 | 142.4 |
| 9-1 | 173.3 |
| 9-1-2 | 157.8 |
| 9-2 | 177.8 |
| 9-2-5 | 165.1 |
| 9-2-6 | 98.3 |
| 9-3 | 153 |
| 9-3-1 | 241.7 |
| 9-3-2 | 228.6 |
| 10-1 | 505.7 |
| 10-1-1 | 259.9 |
| 10-2 | 112 |
| 10-2-2 | 116.4 |
| 10-3 | 663.7 |
| 11-1 | 163.1 |
| 11-2 | 570.1 |
| 11-3 | 345.6 |
| 11-4 | 457.4 |
| 11-4-1 | 494.5 |
| 12-1 | 204.8 |
| 12-1-1 | 300.4 |
| 12-2 | 145.3 |
| 12-3 | 487.4 |
| 12-3-1 | 322.4 |
| 12-4 | 524.5 |
| 12-4-1 | 22 |
* Note
|