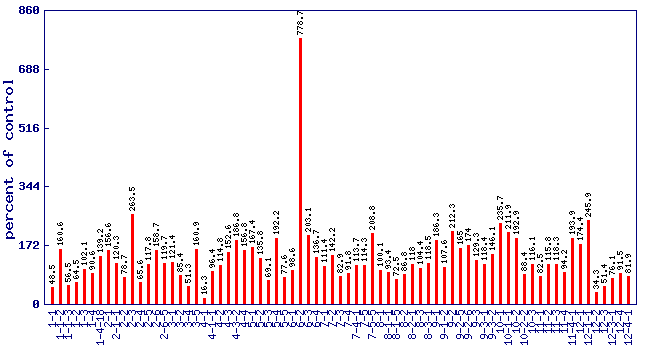
Relative 2-isobutylthiazole level (percent of control)*
Experiment: flavor related metabolite profiling in S. pennellii IL lines (combined)
|
 |
| line | relative level (percent of control) | p value | FDR |
|---|
| 1-1 | 48.5 | 0.0329559 | 0.14125 |
| 1-1-2 | 160.6 | 0.149629 | 0.391775 |
| 1-1-3 | 56.5 | 0.073142 | 0.246033 |
| 1-2 | 64.5 | 0.315538 | 0.599899 |
| 1-3 | 102.1 | 0.950314 | 0.978265 |
| 1-4 | 90.6 | 0.787663 | 0.911193 |
| 1-4-18 | 139.2 | 0.314619 | 0.59949 |
| 2-1 | 156.6 | 0.270536 | 0.556168 |
| 2-1-1 | 120.3 | 0.541025 | 0.790419 |
| 2-2 | 78.7 | 0.534265 | 0.78496 |
| 2-3 | 263.5 | 0.0119796 | 0.0728038 |
| 2-4 | 65.6 | 0.332025 | 0.617441 |
| 2-5 | 117.8 | 0.657689 | 0.858179 |
| 2-6 | 158.7 | 0.189781 | 0.453398 |
| 2-6-5 | 119.7 | 0.624191 | 0.839614 |
| 3-1 | 121.4 | 0.597042 | 0.826252 |
| 3-2 | 85.4 | 0.602151 | 0.82717 |
| 3-4 | 51.3 | 0.0593989 | 0.208117 |
| 3-5 | 160.9 | 0.101316 | 0.307966 |
| 4-1 | 16.3 | 4.36e-08 | 3.32e-06 |
| 4-1-1 | 96.4 | 0.920971 | 0.965177 |
| 4-2 | 114.8 | 0.675044 | 0.867401 |
| 4-3 | 152.6 | 0.152732 | 0.39576 |
| 4-3-2 | 186.8 | 0.0349731 | 0.146999 |
| 4-4 | 156.8 | 0.205108 | 0.472771 |
| 5-1 | 167.4 | 0.1289 | 0.360553 |
| 5-2 | 135.8 | 0.311677 | 0.599025 |
| 5-3 | 69.1 | 0.233208 | 0.5087 |
| 5-4 | 192.2 | 0.0899699 | 0.282865 |
| 5-5 | 77.6 | 0.426843 | 0.696055 |
| 6-1 | 98.6 | 0.97658 | 0.985777 |
| 6-2 | 778.7 | 0.00430004 | 0.0343319 |
| 6-3 | 203.1 | 0.0551664 | 0.198599 |
| 6-4 | 136.7 | 0.441745 | 0.711499 |
| 7-1 | 111.4 | 0.749951 | 0.902305 |
| 7-2 | 142.2 | 0.454035 | 0.720618 |
| 7-3 | 82.9 | 0.558692 | 0.804271 |
| 7-4 | 91.8 | 0.795623 | 0.91516 |
| 7-4-1 | 113.7 | 0.657135 | 0.858179 |
| 7-5 | 114.3 | 0.652732 | 0.855817 |
| 7-5-5 | 208.8 | 0.0368751 | 0.153354 |
| 8-1 | 100.1 | 0.998395 | 0.999242 |
| 8-1-1 | 93.4 | 0.814047 | 0.921519 |
| 8-1-5 | 72.5 | 0.257887 | 0.542533 |
| 8-2 | 86.8 | 0.7634 | 0.902305 |
| 8-2-1 | 118 | 0.507984 | 0.766363 |
| 8-3 | 104.4 | 0.891914 | 0.954653 |
| 8-3-1 | 118.5 | 0.59455 | 0.826175 |
| 9-1 | 186.3 | 0.0355054 | 0.148971 |
| 9-1-2 | 107.6 | 0.841658 | 0.936608 |
| 9-2 | 212.3 | 0.0033076 | 0.0288662 |
| 9-2-5 | 165 | 0.0835493 | 0.269469 |
| 9-2-6 | 174 | 0.115922 | 0.337461 |
| 9-3 | 129.3 | 0.43264 | 0.703562 |
| 9-3-1 | 118.4 | 0.551048 | 0.797149 |
| 9-3-2 | 146.1 | 0.144052 | 0.382233 |
| 10-1 | 235.7 | 0.00380033 | 0.0314427 |
| 10-1-1 | 211.9 | 0.0187528 | 0.0987034 |
| 10-2 | 192.9 | 0.0879468 | 0.277244 |
| 10-2-2 | 88.4 | 0.777444 | 0.908881 |
| 10-3 | 116.1 | 0.684055 | 0.867827 |
| 11-1 | 82.5 | 0.585399 | 0.820185 |
| 11-2 | 115.8 | 0.620184 | 0.837072 |
| 11-3 | 118.3 | 0.662238 | 0.860387 |
| 11-4 | 94.2 | 0.847391 | 0.937451 |
| 11-4-1 | 193.9 | 0.0254551 | 0.120771 |
| 12-1 | 174.4 | 0.0905838 | 0.284416 |
| 12-1-1 | 245.9 | 0.0144445 | 0.0828713 |
| 12-2 | 34.3 | 7.99e-05 | 0.0014382 |
| 12-3 | 51.4 | 0.0153215 | 0.0860193 |
| 12-3-1 | 76.1 | 0.378353 | 0.658552 |
| 12-4 | 91.5 | 0.786147 | 0.911193 |
| 12-4-1 | 81.9 | 0.531273 | 0.783454 |
* Note
- A value of zero means the 2-isobutylthiazole concentration wasbelow the level of dection
- No measure of 2-isobutylthiazole was performed on lines notshown in the figure and table
|
|


