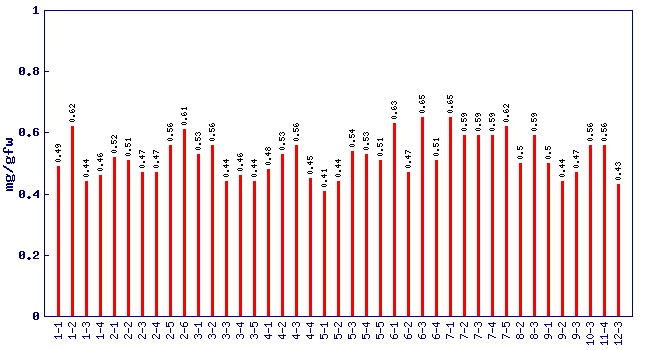
malic acid concentration (mg/gfw)*
Experiment: flavor related metabolite profiling in S. pennellii IL lines (FL, Spring 2001, Field)
|
| line | content (mg/gfw) |
|---|
| 1-1 |
0.49 + 0.022 |
| 1-2 |
0.62 + 0.045 |
| 1-3 |
0.44 + 0.022 |
| 1-4 |
0.46 + 0.007 |
| 2-1 |
0.52 + 0.007 |
| 2-2 |
0.51 + 0.015 |
| 2-3 |
0.47 + 0.007 |
| 2-4 |
0.47 + 0.015 |
| 2-5 |
0.56 + 0.037 |
| 2-6 |
0.61 + 0.022 |
| 3-1 |
0.53 + 0.015 |
| 3-2 |
0.56 |
| 3-3 |
0.44 |
| 3-4 |
0.46 + 0.007 |
| 3-5 |
0.44 + 0.007 |
| 4-1 |
0.48 |
| 4-2 |
0.53 |
| 4-3 |
0.56 + 0.022 |
| 4-4 |
0.45 + 0.015 |
| 5-1 |
0.41 + 0.007 |
| 5-2 |
0.44 + 0.007 |
| 5-3 |
0.54 + 0.03 |
| 5-4 |
0.53 + 0.015 |
| 5-5 |
0.51 |
| 6-1 |
0.63 |
| 6-2 |
0.47 |
| 6-3 |
0.65 + 0.007 |
| 6-4 |
0.51 + 0.03 |
| 7-1 |
0.65 |
| 7-2 |
0.59 + 0.007 |
| 7-3 |
0.59 + 0.015 |
| 7-4 |
0.59 + 0.037 |
| 7-5 |
0.62 + 0.007 |
| 8-2 |
0.5 + 0.037 |
| 8-3 |
0.59 + 0.007 |
| 9-1 |
0.5 + 0.015 |
| 9-2 |
0.44 + 0.007 |
| 9-3 |
0.47 |
| 10-3 |
0.56 + 0.007 |
| 11-4 |
0.56 + 0.022 |
| 12-3 |
0.43 + 0.008 |
* Note
- A value of zero means the malic acid concentration was below the level of dection
- No measure of malic acid was performed on lines not shown in the figure and table
|
|